
Understanding your breakeven point
Most business owners can tell you what they turned over last year. Far fewer can tell you what they need to turn over next month before they can start making a profit – and even fewer know how that number changes throughout the year. That number is your breakeven point: the amount your business needs to earn to cover its costs before it starts making profit. Understanding it can help you make better decisions about your business and your cash flow.
“Almost every owner I sit down with can tell me last year’s turnover. Very few can tell me what next month costs them just to open the doors. It’s the month-by-month number that changes decisions – the annual one just gets filed.”
Andrew Holmes | Director
But breaking even on paper isn’t the same as having cash in the bank.
There are two versions: your textbook breakeven and your cash breakeven.
What is your breakeven point?
The textbook breakeven is your fixed costs divided by your gross margin percentage. If your overheads are $28,000 a month and you make 40 cents in the dollar, you need $70,000 of sales to break even on paper.
For this calculation to work, your margin needs to account for every cost that rises with sales, such as merchant fees, sales commissions and freight – not just the cost of the goods you sell.
But the textbook breakeven doesn’t tell the whole story. The number you actually need is your cash breakeven.
Calculating your cash breakeven
To calculate your cash breakeven, start with your fixed costs and take out depreciation, because it doesn’t leave your bank account. Then add the cash costs that don’t appear in your P&L, such as loan principal repayments and, if you’re a sole trader or in a partnership, the drawings you need to live on. (If you run a company and pay yourself a wage, that’s already in your overheads.) Finally, divide by your margin, just like the textbook calculation for breakeven.
That last step is the one most people skip. Every extra dollar of cost has to come out of your margin, not your sales. At 40 cents in the dollar, $4,000 a month of loan repayments doesn’t need $4,000 more in sales. It needs $10,000.
Using the same example:
- Overheads are $28,000.
- Take out $2,000 of depreciation.
- Add $4,000 of loan principal and $6,000 of drawings.
- That gives $36,000 a month to cover.
- Divided by 40%, your cash breakeven is $90,000, not $70,000.
This number takes into account your fixed costs, removes depreciation, then adds the costs that don’t appear in your P&L, such as loan principal repayments, income tax instalments and the drawings you need to live on.
Ensure you work in GST-exclusive figures throughout, on both costs and sales, or the whole map will be out by up to 10%.
In our experience, for most of the businesses we work with, cash breakeven sits 15 to 30 percent above the textbook figure. This is one of the reasons a business can show a profit, but still not have enough cash to pay itself.
Breakeven is not one number for the year
This is the part almost everyone misses.
Your breakeven moves, and sometimes dramatically. But it usually moves for reasons you can predict months ahead. One recent change has altered the rhythm of your cash flow, and then there are the months to watch.
Payday super: smoother, not bigger
Since 1 July 2026, super must reach your employees’ funds within seven business days of each payday, rather than 28 days after the end of the quarter.
Your annual super cost hasn’t changed. What has changed is when it leaves the bank: every pay run instead of four times a year. Each pay run now needs more cash, but you no longer have a large quarterly super bill to plan around.
July 2026 was a little different, with the April–June quarter’s super due on 28 July at the same time as the first payday super payments. This meant a bigger cash outflow that month, but it was a one-off as you moved from the old quarterly payment cycle to the new system. From here, your cash flow should be smoother, not tighter. If you’re still budgeting on the old quarterly rhythm, update your plan so super is accounted for every month.
With that in mind, here are the months where your breakeven actually moves.
BAS months
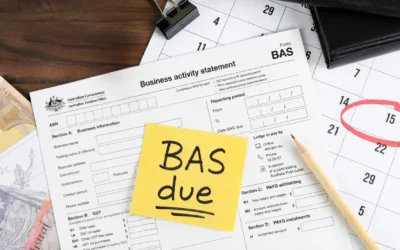
Your BAS isn’t a new cost. The GST you’ve collected from customers and the tax you’ve withheld from wages have been sitting in your bank account for up to three months. The BAS is simply when that money goes to the ATO.
The problem is that it rarely feels like someone else’s money while it’s sitting there. If it’s been used to run the business, the BAS month is when you have to find it all again. That’s what pushes your cash requirement up in those months.
The one genuinely extra cost on your BAS is your PAYG income tax instalment. In BAS months, add it to that month’s cash costs before you divide by your margin, just like loan repayments.
The simplest fix is to move your GST and PAYG withholding into a separate account as it comes in. Do it weekly, or every time a customer pays you. Then the BAS month looks like any other month, apart from the instalment.
For businesses paying BAS quarterly, this means four months a year to watch. If you lodge monthly, the effect is smaller, but it lands every month.
Trading days
January, Easter and the Christmas shutdown give you fewer days to earn the same fixed costs. Meanwhile, your rent, wages and other regular expenses don’t necessarily reduce. A month with 18 trading days instead of 22 carries the same rent.
For retail and hospitality, December is often the busiest month of the year, so map your own pattern rather than assuming.
Annual lumps
Some costs only come around once or a few times a year, such as insurance renewals, WorkCover, licence fees, software subscriptions or vehicle registrations. These costs usually cluster, and when several of them land in the same month, they can create a significant jump in the cash your business needs.
Mapping them early means you can plan for these extra costs rather than being caught off guard.
1 July: the new financial year
Award increases, wage reviews and rent reviews often land together at the start of the new financial year. Award increases take effect from the first full pay period starting on or after 1 July, so check which pay run they first apply to. Once these costs increase, they can permanently lift your business’s baseline costs and, in turn, your breakeven point.
Map it, month by month
Knowing that your breakeven point can change is one thing. The useful part is knowing when it’s going to change. That’s where a month-by-month cash flow map can help.
Create 12 columns, one per month, with your cash breakeven in one row, realistically expected sales beneath it and the gap below that.
You’re looking for the months where your expected sales fall below your cash breakeven. These aren’t always the months you’d expect.
A business can have a strong October and still run out of money if that’s when the BAS, an insurance renewal and a quiet trading fortnight all arrive at once.
Then do something with it
Once you can see the months when your cash breakeven is higher, you can plan ahead rather than waiting for those months to put pressure on your cash flow.
- Pre-fund the higher breakeven months. If you know some months will require more cash than others, use the stronger months to build up a buffer. A good month isn’t a windfall; it’s the deposit on a bad one.
- Push discretionary spending into lower breakeven months. If you have flexibility around when to make purchases, hire staff or run a marketing push, consider timing them for months when your cash breakeven is lower.
- Bring the number down to a target your team can act on. Instead of telling your team you need to make $850,000 over the year, turn this month’s breakeven into something they can use. In our example, a $90,000 month is about $20,800 a week. “We need $20,800 a week this month” or “we need 11 jobs this month” is better than an annual figure nobody remembers.
- Test what happens when your margin changes. If your gross margin drops by three points, work out how much extra revenue you’ll need to cover the difference. In our example, a drop from 40% to 37% lifts the textbook breakeven from $70,000 to about $75,700 a month. It’s usually a confronting number, but it shows just how much a small change in margin affects the amount you need to sell.
What we suggest
Knowing your breakeven point helps you make better decisions, but knowing when it peaks helps you make them at the right time.
Want to know what your breakeven looks like month by month? Get in touch with Business + Numbers and we can help you map out your next 12 months. It’s a short piece of work and you might be surprised by which month puts the most pressure on your cash flow.
This article provides general information only. It doesn’t take your specific business circumstances into account. Please talk to us or your accountant before acting on any of the information provided.